Data Visualization for electrocardiogram (ECG)
Create a real-time visualization tool that maps ECG data to the actual motion of the heart
Problem: A 2D ECG graph of the heartbeat is a representation of the electrical impulses occurring in the heart. This 2D graphical representation of the data makes it difficult to consistently localize complicated electrical signal to specific parts of the heart without extensive training
Background: An electrocardiogram (ECG) is a test which measures the electrical activity of your heart to show whether or not it is working normally. ECGs attempt to represent a 3-dimensional pathway using 2-dimensional structures. Each person has a unique, baseline ECG data set that reflects their individual heart function. As a result. it is difficult to detect changes in ECG data for that individual.
Opportunity:
ECGs are an unintuitive way to attempt to capture the electrophysiology of the heart, causing poor physician learning and retention of knowledge. Doctors learn to recognize patterns on an ECG and correlate them with known pathology as opposed to understanding the true electrical impulses occurring in the heart
- How do visualize ECGs in an intuitive manner?
- How do we allow other health professionals to also read ECGs without as much training?
It can be difficult to consistently localize complicated electrical signal to specific parts of the heart using a traditional ECG without extensive training
- How do we decrease the cognitive load required to read an ECG?
Doctors mostly interpret 10 second ECG strips, despite the machine having access to data occurring over a longer period of time
- How do we visualize more information in an effective way?
- How do we pick the correct information to show?
- How do we find ways to visualize data that improve understanding?
Doctors learn to recognize patterns on an ECG and correlate them with known pathology as opposed to understanding the true electrical impulses occurring in the heart
- Can you manipulate ECG information retrospectively and match it up to patient pathology?
ECGs attempt to represent a 3-dimensional pathway using 2-dimensional structures
Different people have different baseline ECGs making it difficult to analyze an ECG without a previous ECG that is not always available
- How do we normalize ECG tracings to reflect individual differences, such as body habitus?
Resources
ECG Animation - Electrical Changes in Heart
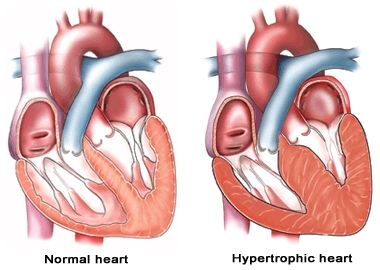
The heart